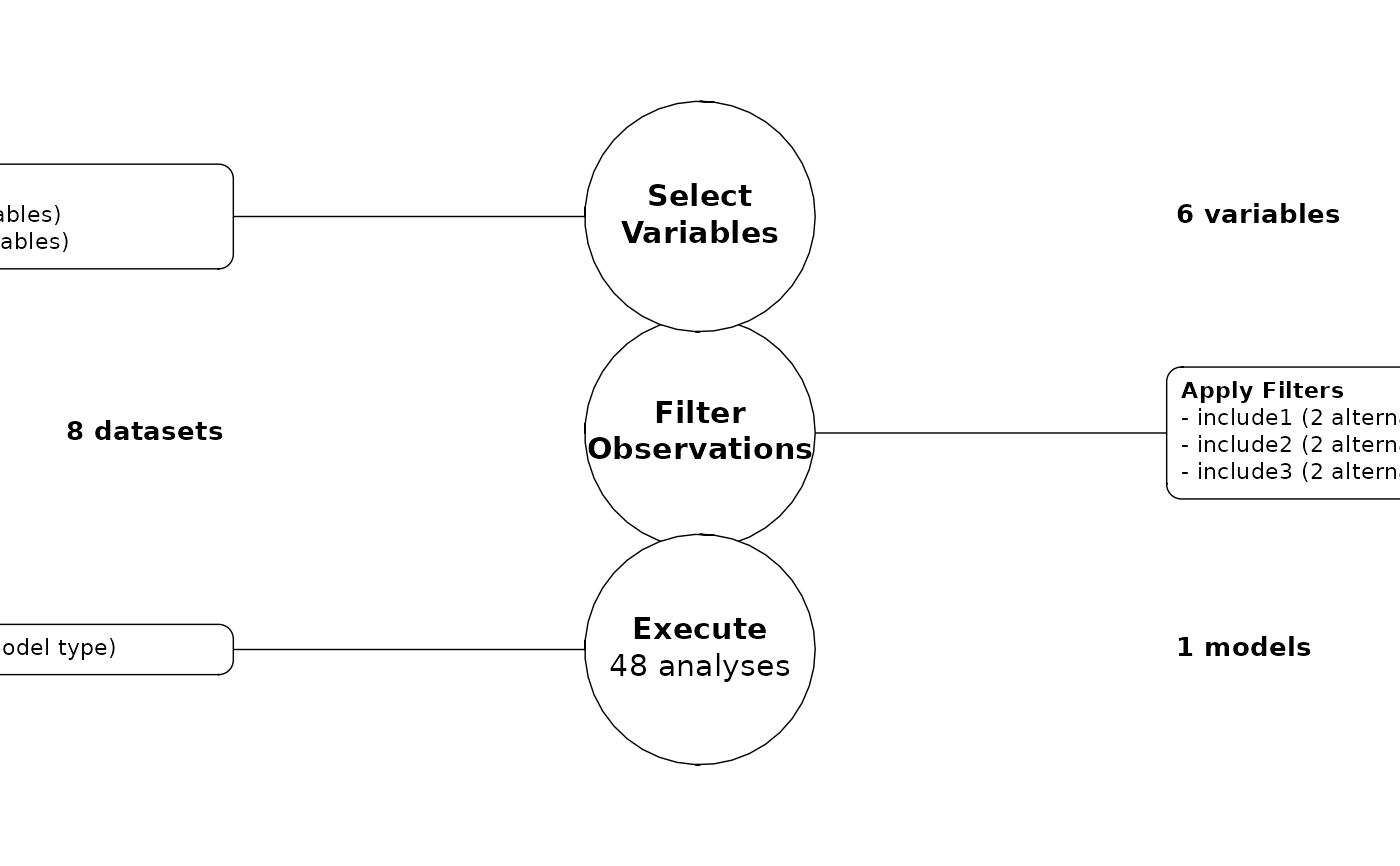
Visualize an analysis pipeline workflow
Usage
visualize_pipeline(
  .pipeline,
  layout = "vertical",
  decision_details = FALSE,
  combinations_detail = FALSE,
  text_sizing = NULL,
  node_space = NULL,
  arrow_spacing = NULL,
  box_space = NULL,
  h_space = NULL,
  v_space = NULL
)
Arguments
- .pipeline
a
data.frameproduced by calling a series of add_* functions.- layout
the orientation of the diagram, can be "horizontal" or "vertical"
- decision_details
logical, whether to provide finer grained details pipeline decisions and their alternatives. Defaults to
FALSE.- combinations_detail
logical, whether to add details on how the analysis space expand given the cross products of pipeline steps and their alternatives. Defaults to
FALSE.- text_sizing
numeric. when not
NULL, multiplies default text sizing to increase or decrease text sizing- node_space
numeric. when not
NULL, determines the spacing between the major nodes of the graph.- arrow_spacing
numeric. when not
NULL, determines the length of arrow segments between the nodes.- box_space
numeric. when not
NULL, determines the length of line segments between the nodes and their detail boxes.- h_space
numeric vector of length 2. when not
NULL, determines how much space to add horizontally to the graph. This is helpful when nodes and/or detail boxes overlap. The first number sets the left hand spacing and the second sets the right hand.- v_space
numeric vector of length 2. when not
NULL, determines how much space to add horizontally to the graph. This is helpful when nodes and/or detail boxes overlap. The first number sets the bottom spacing sizing and the second sets the top.
Examples
library(tidyverse)
library(multitool)

# create some data
the_data <-
  data.frame(
    id  = 1:500,
    iv1 = rnorm(500),
    iv2 = rnorm(500),
    iv3 = rnorm(500),
    mod = rnorm(500),
    dv1 = rnorm(500),
    dv2 = rnorm(500),
    include1 = rbinom(500, size = 1, prob = .1),
    include2 = sample(1:3, size = 500, replace = TRUE),
    include3 = rnorm(500)
  )

# create a pipeline blueprint
full_pipeline <-
  the_data |>
  add_filters(include1 == 0, include2 != 3, include3 > -2.5) |>
  add_variables(var_group = "ivs", iv1, iv2, iv3) |>
  add_variables(var_group = "dvs", dv1, dv2) |>
  add_model("linear model", lm({dvs} ~ {ivs} * mod))

visualize_pipeline(full_pipeline)